Pizza Sales Analysis
Project Overview
A SQL and Excel analysis of a pizza store's transaction data, built to answer four core business questions: how much revenue the store generates, when the busiest ordering hours and days are, which pizza categories and sizes drive the most revenue, and which items are the best and worst performers. All KPIs were calculated directly in SQL, then visualized in an interactive Excel dashboard.
Note on Defensibility: Every KPI here comes directly from a SQL aggregate query against the raw transaction data, not from Excel formulas layered on top of a summary. The queries are documented in full in the repo, so each number traces back to exactly how it was calculated.
Key Performance Indicators
Five core KPIs, each calculated with a single aggregate query. Total revenue, for example:
The same pattern — aggregate function, single table was used for average order value, total pizzas sold, total orders, and average pizzas per order.
Trend Analysis
- Daily trend: Orders peak on Friday and Saturday evenings.
- Hourly trend: Two clear peaks — 12 PM to 1 PM, and 5 PM to 7 PM.
Hourly trend query:
Sales Distribution
By category — Classic leads, but the margin over the rest of the field is narrow:
| Category | Share of Revenue |
|---|---|
| Classic | 26.91% |
| Supreme | 25.46% |
| Chicken | 23.96% |
| Veggie | 23.68% |
By size — Large pizzas dominate revenue, while the largest sizes barely register:
| Size | Share of Revenue |
|---|---|
| Large | 38.05% |
| Medium | 31.65% |
| Small | 29.06% |
| X-Large | 1.17% |
| XX-Large | 0.07% |
Product Performance
The Classic Deluxe Pizza is the best selling item by units sold; the Brie Carre Pizza sells the least. Both were identified with the same query pattern, ranked in opposite directions:
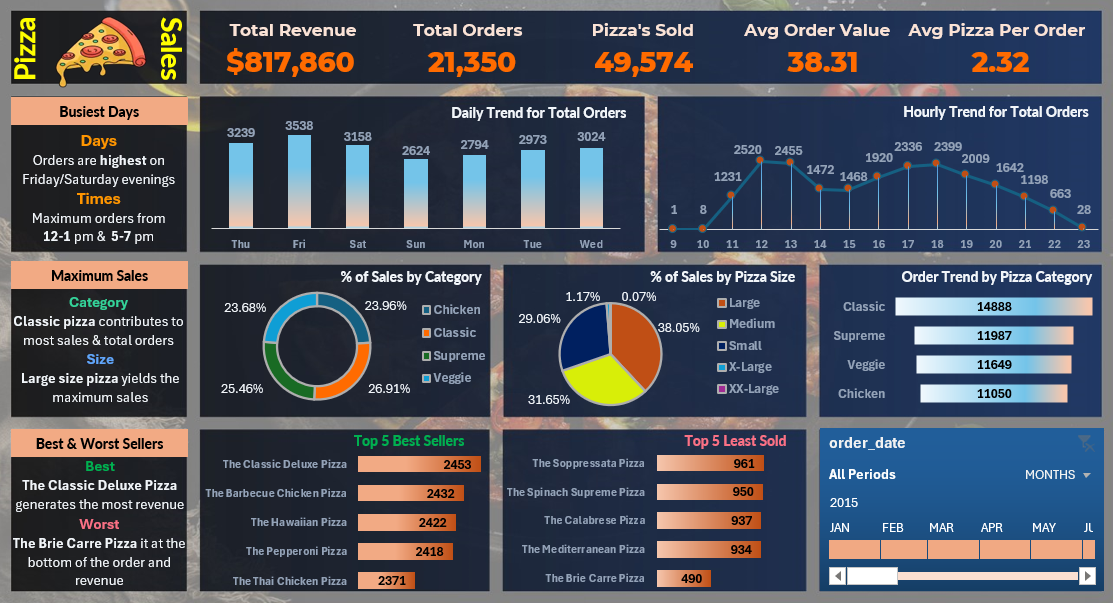
Interactive Excel dashboard built from the SQL analysis above.
Key Insights
- Revenue is fairly evenly split across the four pizza categories. No single category dominates the way order patterns might suggest.
- Size drives revenue more than category does: Large alone accounts for over a third of total revenue, while X-Large and XX-Large combined make up barely more than 1%.
- Demand is concentrated around lunch and dinner hours, and weekends — a pattern that would directly inform staffing and inventory decisions in a real operating context.