Maven Toys Sales Analysis
Project Overview
The goal of this project was to analyze commercial performance across multiple toy retail outlets, identifying growth opportunities, high-performing product categories, and margin pressure points. Using SQL Server for relational data modeling and Power BI for reporting, I built a 5-page interactive dashboard.
Note on Defensibility: Rather than just reporting aggregate metrics, I integrated external research on retail seasonality to explain the why behind sales trends, validating claims with data rather than assumptions.
Data Pipeline & Prep (SQL)
The source data consisted of six relational CSV tables (Sales, Products, Stores, Inventory, and Calendar). The initial cleaning phase required handling mismatched formats, sorting store locations, and validating primary-foreign key integrity.
Key steps executed in SQL:
- Standardized currency values into uniform decimals.
- Handled null values in transaction fields without skewing monthly averages.
- Constructed rolling sales metrics and year-over-year revenue aggregations.
Power BI Dashboard Architecture
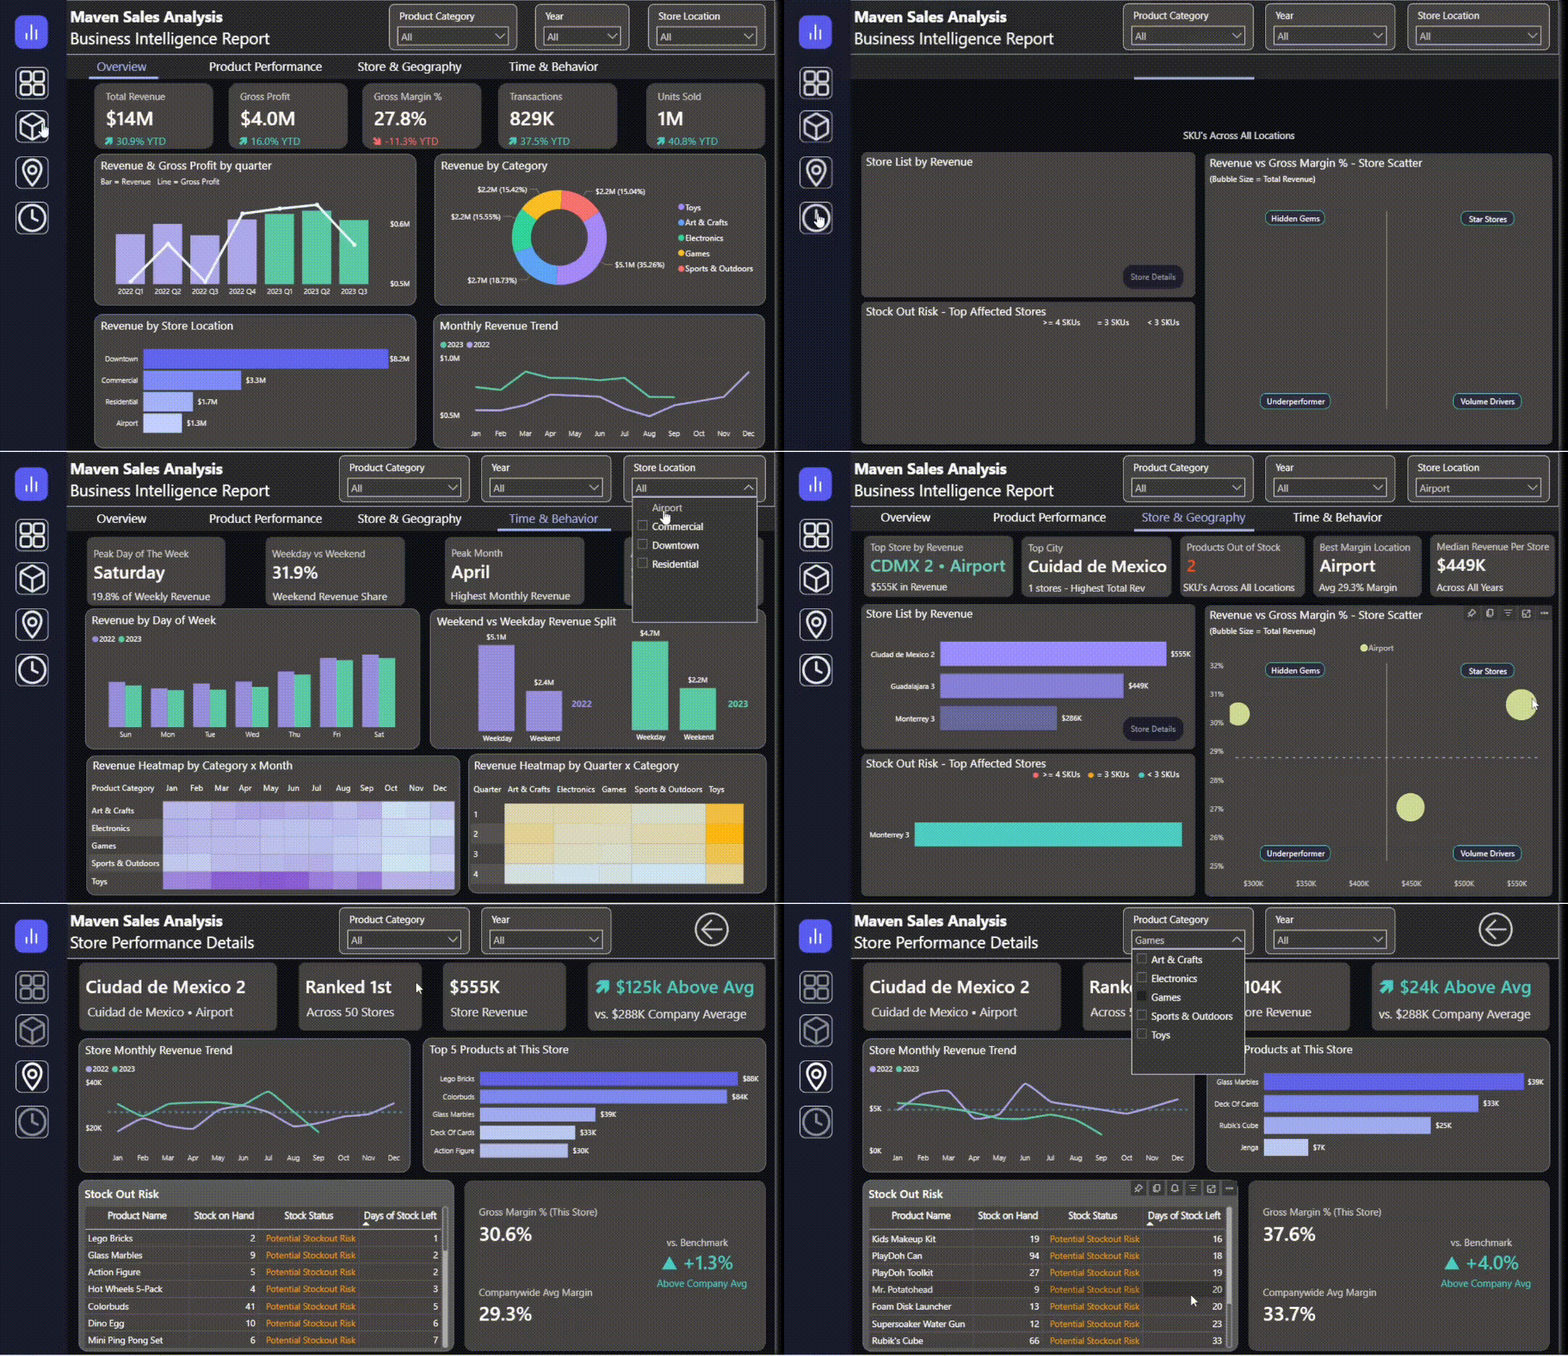
The interactive report contains five dedicated dashboards that analyze the data from different business angles:
- KPI Scorecards: Visual summaries tracking total revenue ($14M), units sold (~1M), and gross margin (26.2%, down from 29.3% the prior year despite 30.9% revenue growth).
- Sales Trend: A breakdown showing sales peaks during seasonal holidays, including a spike around Día del Niño.
- Product Category Performance: Toys drives the highest revenue volume but carries the lowest margin (21.2%), while Electronics is the highest-margin category (44.6%). Colorbuds stands out as a top-performing high-margin product.
- Store Performance Grid: Location-based ranking showing airport-format stores outperforming on margin relative to other store formats.
- Inventory Forecast: Outlining store locations containing high stock volumes of low-turnover items.
Key Insights & Business Outcomes
Revenue grew 30.9% year over year, but margin dropped from 29.3% to 26.2% over the same period. So growth came at a cost. The category breakdown shows why. Toys is the top revenue category, but it's also the lowest-margin one. Meanwhile, higher-margin categories like Electronics grew much slower.
- Finding: Store format matters as much as location. Airport-format stores post stronger margins than other formats, regardless of city.
- Implication: When low-margin categories drive most of the revenue growth, the margin base can quietly shrink underneath it. That's easy to miss if you're only tracking top-line revenue.